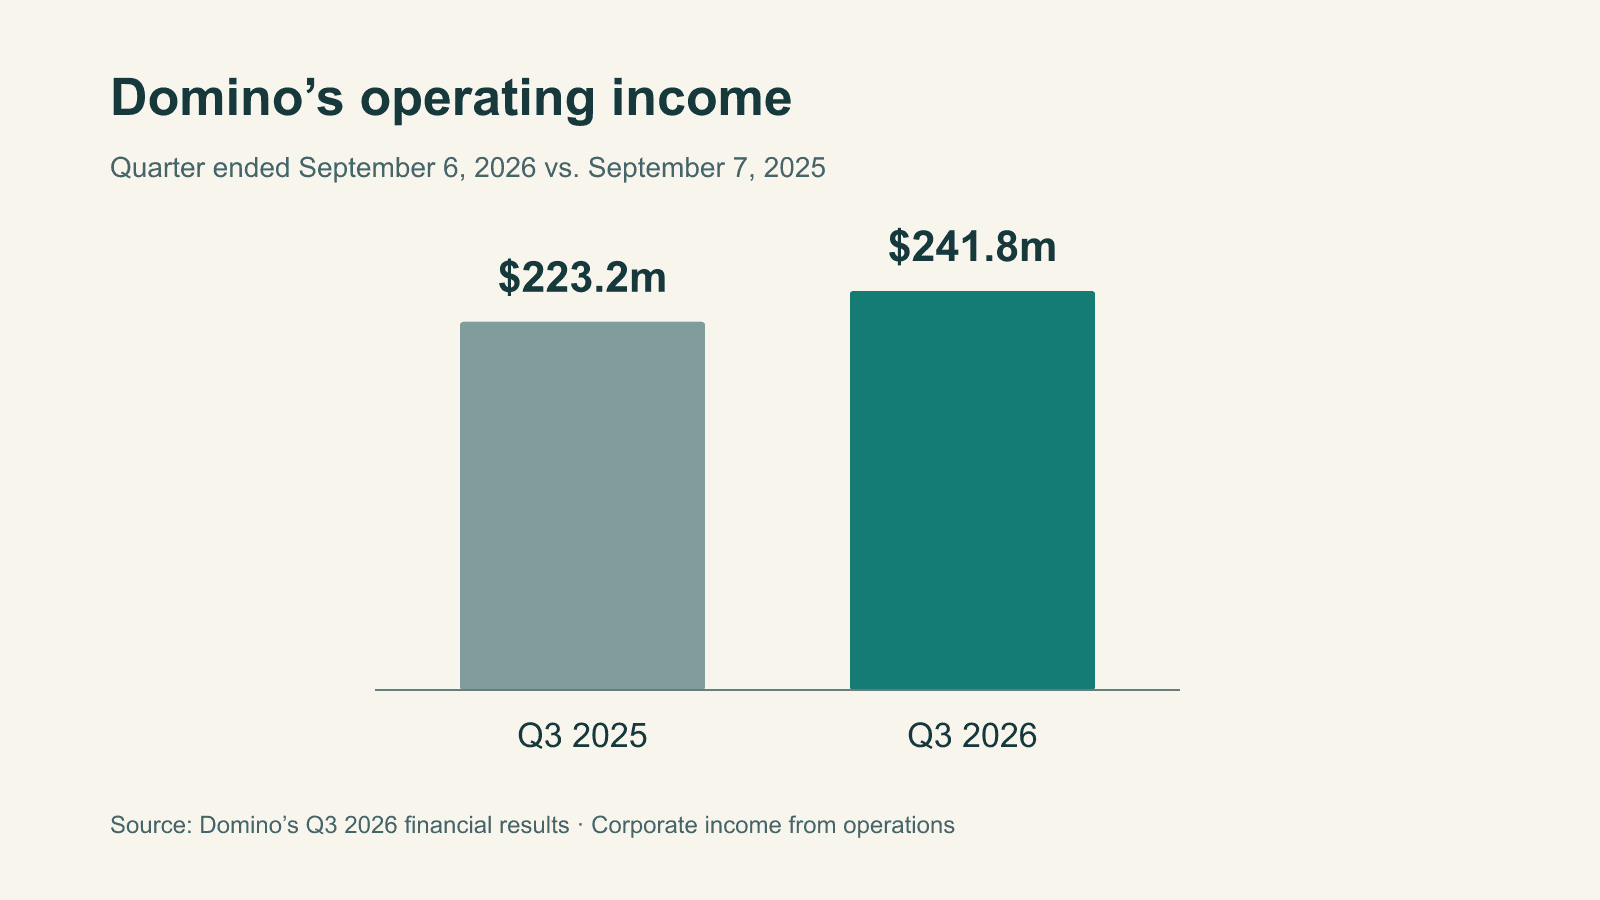
Domino’s third-quarter operating income rose 8.3% to $241.8 million, while U.S. same-store sales increased 0.3%. Supply-chain gross profit and franchise royalties accounted for the corporate gain in the October 13 results.
Domino’s is primarily a franchisor; independent operators run about 99% of its global stores as of September 6. It earns sales-based royalties and sells food and other products through supply operations primarily in the U.S. and Canada. Franchisees’ retail sales are excluded from corporate revenue.
Domino’s defines same-store sales using restaurants with sales in comparable weeks of both periods. Its separate net-store-growth measure counts openings less closures, excluding transfers between company and franchise ownership. Sales definitions.
QSR.pro’s income-statement calculation yields this Q3 year-over-year bridge:
| Change from Q3 2025 | USD millions |
|---|---|
| Supply-chain gross profit | +11.960 |
| U.S. royalties and fees | +8.483 |
| International royalties and fees | +5.151 |
| Company-store gross profit | −6.149 |
| General and administrative expense | −0.634 |
| Refranchising loss | −0.206 |
| Advertising, net | 0.000 |
| Operating-income increase | +18.605 |
Gross profit here is revenue less corresponding cost of sales. Advertising revenue and expense offset.
Domino’s attributed royalty growth chiefly to a larger average franchise store base following net openings over the trailing four quarters, beyond Q3’s 26 net U.S. openings. Franchise revenues carry no cost-of-sales charge, so higher royalties flow directly into gross profit.
Supply-chain gross margin rose to 12.2% from 11.3%. Domino’s credited procurement productivity for a 0.7-percentage-point reduction in the food-cost ratio, and sales leverage and labor efficiency for a 0.5-point labor improvement. Higher fuel-related delivery expense partly offset those gains. Supply-chain costs.
The U.S. store supply basket, covering food and cardboard, became 2.2% more expensive year over year. Domino’s estimated that pricing added $17 million to supply revenue. It attributed lower company-store revenue to Q2 refranchising. Revenue discussion.
Company-store gross margin also narrowed to 12.0% from 16.3%, with higher food, wage and insurance costs. Store costs.
In the second quarter, U.S. comparable sales rose 0.1%, while operating income increased 3.1% to $232.0 million. Supply-chain gross margin improved to 12.0% from 11.8%. That release attributed the improvement primarily to procurement productivity, partly offset by higher food-basket costs.
Calculations from Q2’s income statement put supply-chain gross profit at $88.0 million, up $7.1 million from a year earlier. General and administrative expense increased $7.8 million, while company-store gross profit fell $5.1 million. Together, those two offsets exceeded the supply-chain gain, before accounting for royalties and refranchising gains. Domino’s linked the higher overhead primarily to its Worldwide Rally, held every two years. Q2 operating-income discussion.
The year-over-year supply-chain margin gain widened from 0.2 percentage points in Q2 to 0.9 points in Q3.
QSR Pro Staff
The QSR Pro editorial team covers the quick service restaurant industry with in-depth analysis, data-driven reporting, and operator-first perspective.
More from QSR