U.S. food services and drinking places had 7,200 fewer payroll jobs in October than in September after seasonal adjustment, the Bureau of Labor Statistics reported November 6. For an owner comparing limited-service restaurants nationwide, that report’s latest figures cover September. That month, limited-service payrolls fell by 4,900 jobs even as the broader sector added 11,000. BLS employment report · Employment by restaurant format
The preliminary October estimate puts the sector at 12,383,700 jobs, seasonally adjusted, or 57,200 more than a year earlier. That total includes bars and caterers as well as restaurants. In the detailed table BLS posted November 6, dashes mark the October estimates that were still unavailable for individual restaurant formats. October payroll table · Detailed table and footnotes
Which restaurants belong in the comparison?#
Consider an owner with two pizzerias. At one, servers usually take orders at the table and bring the pizza. Diners pay after eating. That’s full service, even with pickup. At the other, guests usually order and pay at the counter before eating. That’s limited service whether they stay or take out. Census restaurant definitions
BLS assigns each establishment an industry by its main activity. A coffee shop next door might also take orders at the register. If it mainly serves coffee to drink there or nearby, its benchmark is snack and nonalcoholic beverage bars. BLS industry classification · Census industry definitions
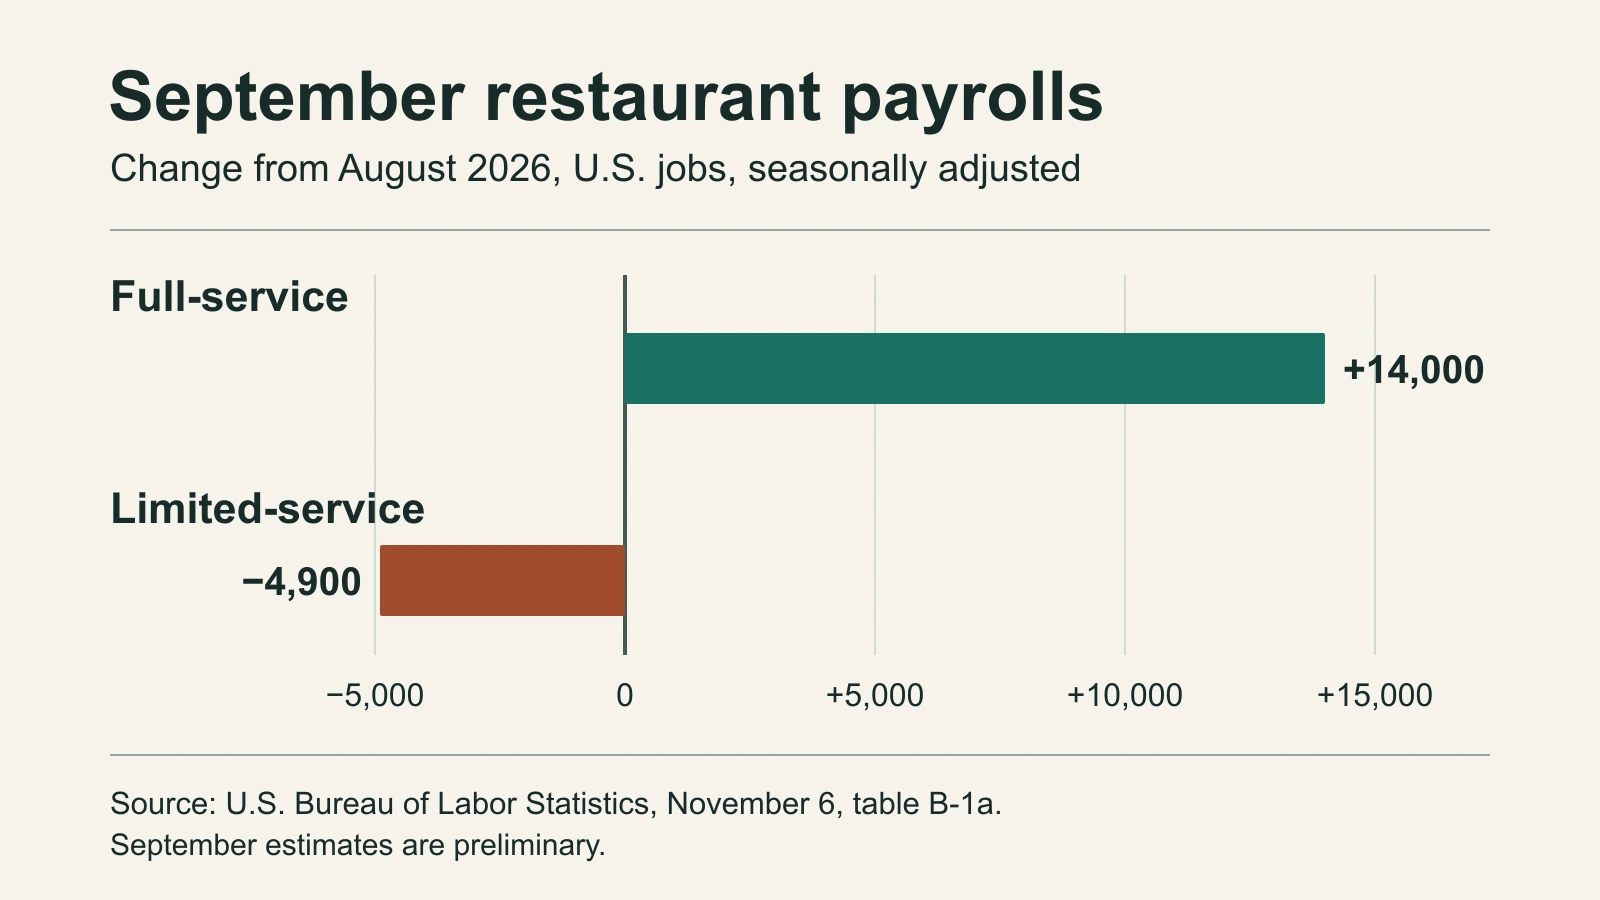
From August to September, full-service restaurants added an estimated 14,000 jobs, a 0.26% increase from their August payroll. Limited-service restaurants lost 4,900, down 0.11% from their own August level. The counter-service pizzeria’s national benchmark fell even as sector payrolls grew. The September estimates are preliminary and seasonally adjusted. BLS restaurant payroll estimates · Sector payrolls
The sector includes cafeterias and buffets, which share a separate row. BLS adjusts the full-service and limited-service series independently for seasonal patterns, so the individual changes need not add up to the sector total. Detailed industry rows and adjustment notes
A revised starting point for October#
Suppose the owner’s September report still shows the sector at 12,393,000 jobs. That was the bureau’s first estimate, released October 2. It showed a gain of 10,800 jobs, the figure in QSR.pro’s coverage of the September report. Put the new October total beside that September figure and the spreadsheet shows a loss of 9,300. It overstates the decline by 2,100 jobs. October 2 release · November 6 release
The November release lowered September’s level to 12,390,900. It lowered August’s by slightly more, from 12,382,200 to 12,379,900. As a result, September gained 11,000 jobs on the revised figures, 200 more than originally reported, even though its payroll level came down. BLS revises its monthly estimates as additional employer reports arrive and it recalculates seasonal factors. First September estimate · Revised levels · BLS revision method
In the owner’s October staffing report, the national food-service line can show a decline of 7,200 jobs from September’s revised level. For the counter-service pizzeria, the national limited-service line still shows a loss of 4,900 jobs in September. Its October cell stays blank. Sector payrolls · Restaurant formats
QSR Pro Staff
The QSR Pro editorial team covers the quick service restaurant industry with in-depth analysis, data-driven reporting, and operator-first perspective.
More from QSR